
Something fundamental has shifted in the economics of car ownership. For the first time in history, the average new car in the United States costs more than $50,000. The Navy Federal Cost of Car Ownership (COCO) Index — which tracks 11 key ownership expenses — surged 40.59% from January 2020 to August 2025, dramatically outpacing the 24.79% rise in overall consumer prices over the same period.
This isn't just an American problem. From London to Lagos, São Paulo to Seoul, the affordability of personal vehicle ownership is deteriorating at a pace that is reshaping how people think about transportation. In this report, we examine every dimension of the crisis: why it happened, where it's worst, what the global data shows, and what practical steps you can take to protect your finances.
01The COCO Index: Measuring the True Cost Surge
The Navy Federal Cost of Car Ownership (COCO) Index is the most comprehensive measure of vehicle ownership affordability. It tracks 11 individual cost components — from gasoline and insurance to repairs, registration, and financing — and combines them into a single composite score. The index hit an all-time high in January 2025 and remains near that peak.
COCO Index vs. Consumer Price Index (2020–2025)
Base 100 = January 2020 | Source: Navy Federal Credit Union COCO Index, U.S. Bureau of Labor Statistics
COCO Index rose 40.6% from 2020–2025 vs. 24.8% for overall CPI — a 16-point gap representing the "affordability squeeze"
The 15.8-point gap between the COCO Index and overall inflation is what economists call the "affordability squeeze." It means car ownership costs have risen at nearly twice the rate of general inflation — eroding the real purchasing power of drivers faster than almost any other household expense category.
02New Car Prices: The $50,000 Threshold

The average transaction price for a new vehicle in the United States crossed $50,000 for the first time in 2025, according to Kelley Blue Book data. This milestone — which would have seemed unthinkable just a decade ago — is the result of a perfect storm: pandemic-era supply chain disruptions, semiconductor shortages, a shift toward larger and more expensive vehicles, and the addition of costly advanced driver assistance systems (ADAS) to even entry-level models.
Average New Car Transaction Price (USA, 2019–2025)
Source: Kelley Blue Book / Cox Automotive Market Insights
Red bar = 2025 record high. Price rose 33% in just 6 years.
Why Have Car Prices Risen So Dramatically?
The income-to-car-price ratio tells an even starker story. In 2015, the average new car cost 59.4% of median annual household income. By 2025, that ratio had climbed to 64.5% — meaning the average American now needs to spend nearly two-thirds of a full year's income to buy an average new car. For the bottom half of earners, the ratio exceeds 100%, making new car ownership mathematically impossible without financing.
03The Insurance Shock: +46% in Two Years
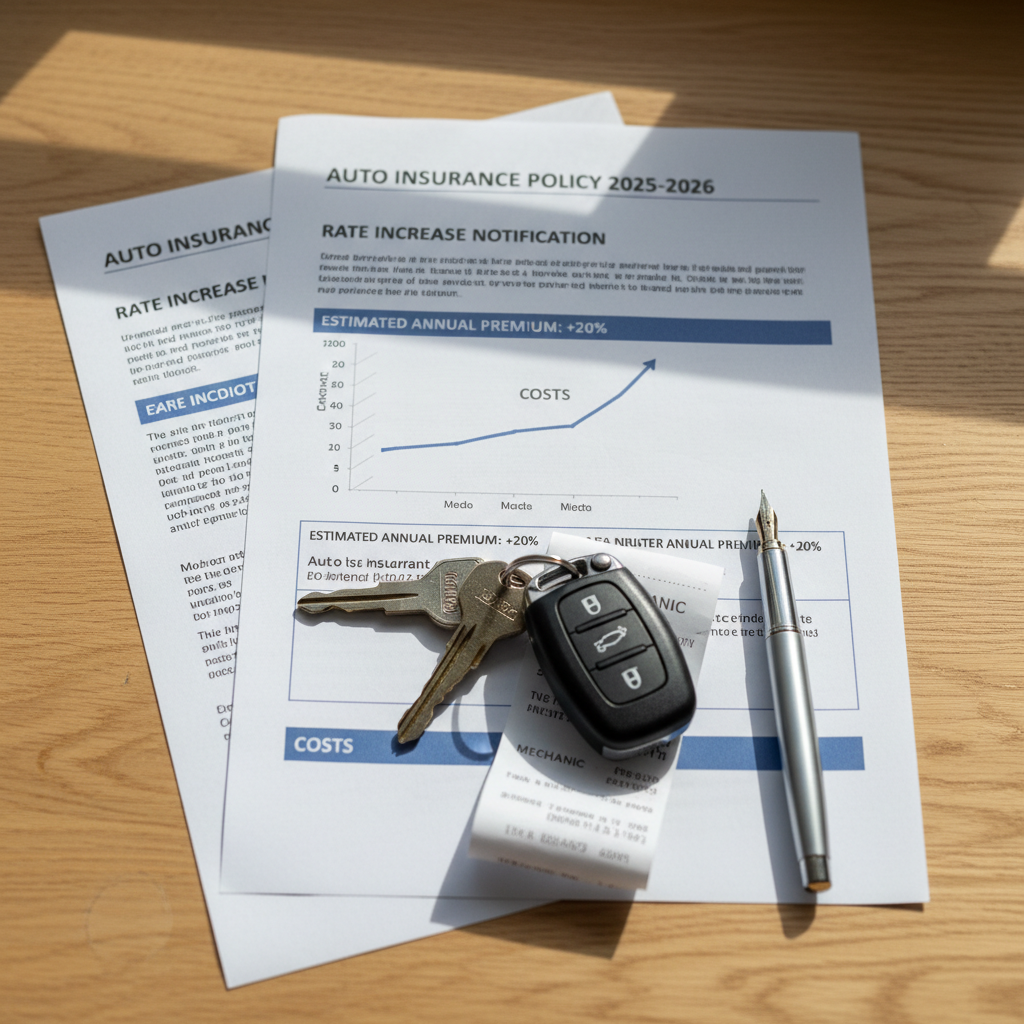
Of all the components driving the car affordability crisis, insurance has been the most dramatic. The average cost of full-coverage car insurance in the United States rose 46% from 2022 to 2024 — from $1,771 to $2,513 per year — before partially stabilizing in 2025. According to CarInsurance.com's analysis of 65.7 million quotes, the 2026 average stands at $2,578 per year, with some states charging more than $4,000.
Average Annual Full-Coverage Car Insurance (USA, 2020–2026)
Source: CarInsurance.com analysis of 65.7M quotes; Insurify 2026 State of Insurance Report
| State | 2025 Avg Annual | 2026 Projected | YoY Change |
|---|---|---|---|
| Washington D.C. | $4,017 | $4,088 | +1.8% |
| Maryland | $3,601 | $3,594 | -0.2% |
| Rhode Island | $3,394 | $3,450 | +1.7% |
| Michigan | $3,073 | $3,079 | +0.2% |
| New York | $3,019 | $3,041 | +0.7% |
| New Jersey | $2,983 | $3,024 | +1.4% |
| Iowa | $1,246 | $1,230 | -1.3% |
| New Hampshire | $956 | $957 | +0.1% |
Source: Insurify analysis of 197M+ insurance rates, January 2026
Why Did Insurance Costs Spike So Dramatically?
The insurance surge has four root causes: (1) Rising repair costs — modern vehicles with ADAS sensors, cameras, and complex electronics cost 40–60% more to repair after a collision than older vehicles; (2) Climate-related losses — the US saw 27 billion-dollar weather disasters in 2024 alone, flooding an estimated 347,000 vehicles; (3) Litigation inflation — "billboard attorney" advertising has driven up bodily injury claim costs in states like Florida, Georgia, and New Jersey; (4) Tariff pass-through — tariffs on imported auto parts are expected to add 3–4 percentage points to insurance costs in 2026 as existing inventories deplete.
The affordability gap is widening. According to The Zebra's Premium Pressure Index, the median American now spends 2.6% of their annual income on car insurance alone. In Louisiana, that figure exceeds 5%. For low-income households, insurance can represent 8–12% of take-home pay — a figure that financial advisors consider a crisis threshold.
04The Repair Cost Surge: Technology's Hidden Tax
Repair costs have risen 11.5% in the past year alone — the fastest pace in decades. The primary driver is the proliferation of Advanced Driver Assistance Systems (ADAS): cameras, radar sensors, LiDAR units, and ultrasonic sensors that are now standard on virtually every new vehicle. A single front-facing camera system that requires recalibration after a windshield replacement can add $1,200–$2,400 to what was once a $300 repair.
Repair Cost Inflation by Category (Past 12 Months)
Source: CCC Intelligent Solutions Crash Course Report 2025; Navy Federal COCO Index
The ADAS Repair Premium
Tariff Impact on Parts Costs
The 2025 tariffs on imported auto parts — including 25% tariffs on steel and aluminum, and additional tariffs on Chinese-made components — have directly increased the cost of replacement parts. According to Reinsurance News analysis, these tariffs are expected to add 3–4 percentage points to insurance costs in 2026 as existing inventories work through the supply chain.
05Global Perspective: The Affordability Gap by Country

The car affordability crisis is a global phenomenon, but its severity varies enormously by country. The most useful metric is the "months of median income" required to purchase an average new car — a figure that ranges from 6.8 months in Japan to 42.1 months in India. This disparity reflects differences in wages, vehicle pricing, import tariffs, and the availability of affordable domestic models.
Months of Median Income to Buy an Average New Car (2025)
Source: World Bank income data, IHS Markit vehicle pricing, CarCostBreakdown analysis
| Country | Avg New Car Price | Median Annual Income | Annual Ownership Cost | % Income on Car |
|---|---|---|---|---|
| 🇺🇸 USA | $50,000 | $74,481 | $12,182 | 16.4% |
| 🇩🇪 Germany | €38,000 | €45,200 | €9,800 | 21.7% |
| 🇬🇧 UK | £35,000 | £34,963 | £8,400 | 24.0% |
| 🇯🇵 Japan | ¥3.8M | ¥4.9M | ¥1.2M | 24.5% |
| 🇦🇺 Australia | A$52,000 | A$67,600 | A$13,200 | 19.5% |
| 🇧🇷 Brazil | R$120,000 | R$36,000 | R$28,000 | 77.8% |
| 🇮🇳 India | ₹1,200,000 | ₹240,000 | ₹180,000 | 75.0% |
| 🇿🇦 South Africa | R480,000 | R132,000 | R96,000 | 72.7% |
Sources: World Bank, OECD, IHS Markit, national statistics offices. Annual ownership cost includes all 8 cost categories.
For a deeper dive into global car ownership rates and costs by country, see our Global Car Ownership Report 2026 which covers 195 countries with World Bank data.
06The Used Car Escape Hatch — And Its Limits
With new car prices averaging $50,000, millions of buyers have turned to the used car market as a refuge. But the escape hatch is narrowing. Used vehicle prices have risen 5.1% over the past year, driven by strong demand from buyers priced out of the new car market. The average used car now costs $28,000–$32,000 — still significantly less than new, but representing a 40% increase from pre-pandemic levels.
For a detailed comparison, see our New Car vs Used Car: Total Cost Comparison guide, which includes 5-year breakeven analysis for 10 popular models. For CPO specifically, our Certified Pre-Owned Guide explains when the premium is worth paying.
07The EV Paradox: Cheaper to Run, Expensive to Own
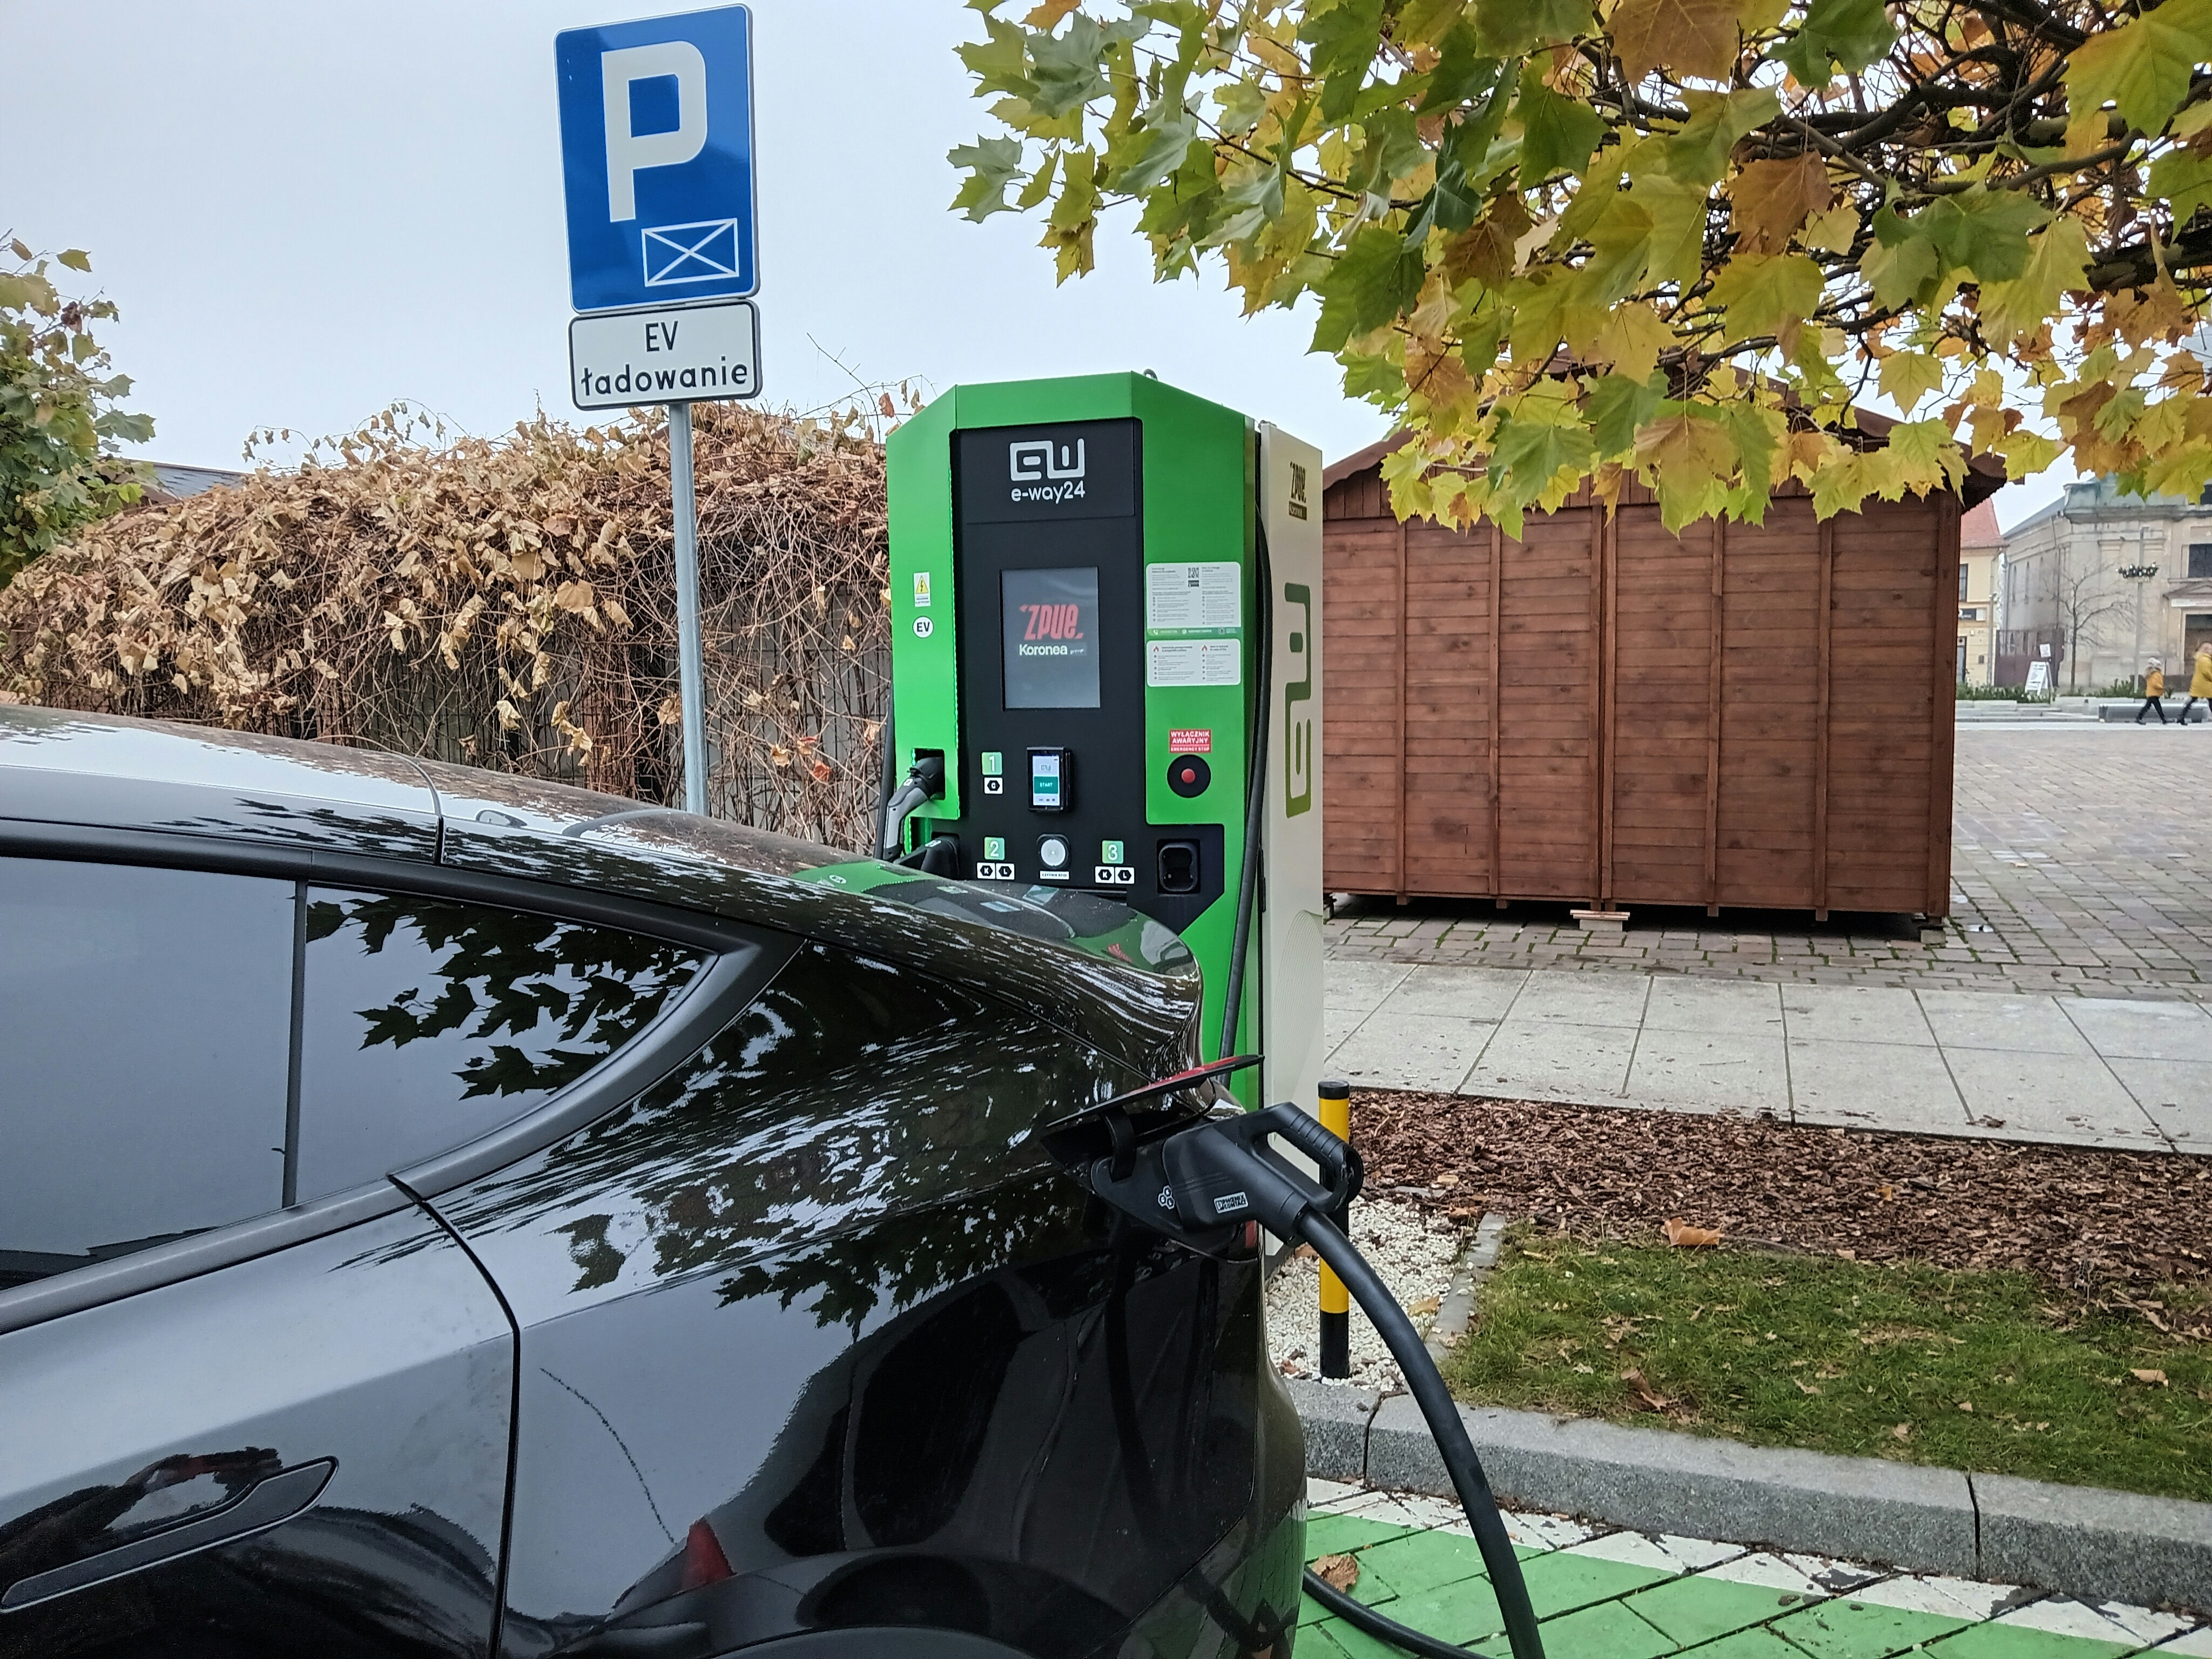
Electric vehicles present a paradox within the affordability crisis. On one hand, they offer dramatically lower running costs: home charging costs $480–$600 per year vs $1,980 for gasoline, and maintenance savings of $1,800–$2,400 over 5 years (no oil changes, fewer brake jobs, no transmission service). On the other hand, EVs average $10,000 more than comparable gas vehicles before incentives, and they're more expensive to insure — Tesla Model S premiums rose 9% in 2025 while most gas car premiums fell.
5-Year Total Cost of Ownership: EV vs Gas (2026)
After $7,500 federal tax credit. 12,000 miles/year, home Level 2 charging at $0.16/kWh. Source: CarCostBreakdown analysis
| Comparison | EV Net Price | Gas Price | EV 5-yr TCO | Gas 5-yr TCO | Winner |
|---|---|---|---|---|---|
| Tesla Model 3 vs Honda Accord | $32,740 | $28,900 | $46,200 | $47,250 | EV +$1,050 |
| Chevy Equinox EV vs Toyota RAV4 | $27,495 | $32,800 | $44,800 | $55,400 | EV +$10,600 |
| Hyundai IONIQ 6 vs Hyundai Sonata | $31,115 | $27,900 | $43,200 | $46,800 | EV +$3,600 |
| Chevy Bolt EV vs Honda Civic | $19,000 | $24,950 | $38,200 | $44,200 | EV +$6,000 |
| Rivian R1T vs Ford F-150 | $67,500 | $44,800 | $78,200 | $72,400 | Gas -$5,800 |
For most buyers, EVs now offer a lower 5-year total cost of ownership than comparable gas vehicles — but only after the $7,500 federal tax credit. The credit's income limits ($150K single, $300K joint) and vehicle price caps ($55K cars, $80K trucks) mean it's not available to everyone. For a complete analysis, see our EV Total Cost of Ownership Guide.
08Where Your $12,182 Goes: The Complete Cost Breakdown
According to AAA's 2026 Your Driving Costs study, the average American now spends $12,182 per year to own and operate a new vehicle — a record high. But most people only think about the monthly payment, which represents just 52% of the true annual cost. The other 48% — depreciation, insurance, fuel, maintenance, registration, and tires — is what catches people off guard.
Annual Cost Distribution ($12,182 total)
For a complete breakdown of all 8 cost categories with strategies to reduce each one, see our True Cost of Car Ownership guide. To understand how much car you can actually afford based on your income, use our Car Budget by Salary calculator.
09What You Can Do: 8 Strategies to Beat the Affordability Crisis

Buy 2–3 Years Used
Save $8,000–$15,000Let someone else absorb the 20% first-year depreciation. A 2-year-old Toyota Camry costs $28,000 vs $32,000 new — and has already lost the steepest part of its depreciation curve.
New vs Used guideShop Insurance Every 2–3 Years
Save $400–$800/yrInsurance loyalty is penalized. New customers get 15–25% lower rates than long-term customers. With premiums at record highs, switching insurers can save $600–$1,200 annually.
Insurance savings guideGet Pre-Approved Financing
Save $1,500–$3,000Dealer financing averages 7.1% APR. Your bank or credit union may offer 5.5–6.5%. On a $30,000 loan over 60 months, every 1% reduction saves $600 in total interest.
Loan vs cash guideConsider an Affordable EV
Save $3,000–$8,000 over 5 yrsThe Chevy Bolt EV at $19,000 after the $7,500 federal credit has a lower 5-year TCO than a Honda Civic. Fuel savings of $1,400/yr and maintenance savings of $400/yr add up fast.
Best EVs under $40KUse the 15% Income Rule
Avoid financial stressTotal car costs (payment + insurance + fuel + maintenance) should not exceed 15% of gross monthly income. On $60,000/year, that's $750/month maximum for all car expenses.
Car budget by salaryNegotiate Aggressively
Save $2,000–$6,000Data shows buyers who negotiate save 5–12% off MSRP. End-of-month and end-of-year timing adds another 3–8%. December 31st is historically the best day to buy a car.
Negotiation tactics guideKeep Your Car Longer
Save $4,000–$8,000/yrYear 6 of car ownership — when the loan is paid off — is the cheapest year. Annual costs drop from $15,200 (year 1) to $8,200 (year 6). Keeping a reliable car for 8–10 years is the single best financial decision.
True cost guideChoose High-Resale Models
Save $3,000–$6,000 at saleToyota Tacoma retains 72% of its value after 3 years. BMW 3 Series retains only 42%. Choosing a high-resale-value vehicle reduces your effective depreciation cost by $1,000–$2,000 per year.
Car depreciation guide10Looking Ahead: Will the Crisis Ease in 2026–2027?
The outlook for car affordability in 2026–2027 is cautiously mixed. Several forces are working in consumers' favor: insurance competition is intensifying, EV prices are falling (the average EV price dropped 22% from 2022 to 2025), and used car supply is gradually improving as pandemic-era vehicles age into the used market. However, structural headwinds remain: tariffs on imported parts are expected to add $1,500–$3,000 to new car prices, climate-related insurance losses are accelerating, and the shift to expensive ADAS technology shows no signs of reversing.
| Factor | Direction | Impact on Affordability |
|---|---|---|
| EV prices | ↓ Falling | Positive — avg EV price down 22% since 2022 |
| Insurance competition | ↑ Increasing | Positive — more shopping options, 6% avg drop in 2025 |
| Used car supply | ↑ Improving | Positive — more 2021–2023 vehicles entering used market |
| Federal EV tax credit | ⚠ Uncertain | Neutral/Negative — credit may be reduced or eliminated |
| Auto tariffs | ↑ Increasing | Negative — adds $1,500–$3,000 to new car prices |
| Climate-related losses | ↑ Worsening | Negative — driving insurance costs higher in vulnerable states |
| ADAS technology costs | ↑ Increasing | Negative — repair costs rising 18.7% for sensor-equipped vehicles |
| Interest rates | ↓ Easing | Positive — Fed rate cuts reducing auto loan APRs |
Our 2026–2027 Forecast
We expect the car affordability crisis to persist through 2026 but begin to ease modestly in 2027. New car prices will remain above $48,000 due to tariff pressures and technology costs. Insurance will stabilize near current levels with a 1–4% increase nationally. The biggest relief will come from the used car market, where supply is improving, and from EVs, where falling battery costs are making affordable electric vehicles increasingly viable.