
2026 Global Snapshot
The global car market has never been more complex — or more consequential. In 2026, approximately 1.5 billion passenger vehicles are registered worldwide, a figure that has grown by 400 million in just fifteen years. Yet the distribution of those vehicles is profoundly unequal: the United States alone accounts for roughly 290 million registered cars, while the entire African continent — home to 1.4 billion people — has fewer than 60 million.
This report synthesises data from the International Organisation of Motor Vehicle Manufacturers (OICA), the International Energy Agency (IEA), the World Bank, and proprietary cost modelling across 195 countries to give you the most comprehensive picture of global car ownership available in 2026. Whether you're a consumer comparing costs, a policy analyst tracking decarbonisation, or an investor watching the EV transition, this is your definitive reference.
1. Global Car Ownership Rates by Country
Cars per 1,000 inhabitants — economies present in world-bank-data.json (WB indicator IS.VEH.NVEH.P3)
Loading vehicle-density series from `/api/data/world-bank-data.json`…
The United States remains among the most car-saturated large economies at — cars per 1,000 people in the latest pipeline pull — meaning there are often almost as many registered vehicles as adults. Australia follows at —, Germany at —, and Japan at — in the same feed. These are statistical snapshots, not national registry totals.
China's —-per-1,000 reading still understates absolute fleet scale because of population mass; pair density with UN population tables if you need totals. India's —-per-1,000 rate remains the standout structural growth story for the decade ahead.

Asia's megacities are reshaping global car ownership patterns. Photo: Unsplash
📊 Highest vehicle density in pipeline file (per 1,000 people)
No vehicle-density rows returned from the World Bank JSON yet.
Europe's 290 million vehicles are distributed across 44 countries with vastly different ownership cultures. Luxembourg tops the European table at 696 per 1,000; Poland sits at 680; while Romania (380) and Hungary (420) reflect the lower end of EU ownership rates. Outside the EU, Turkey (220 per 1,000) is growing rapidly as its domestic automotive industry expands.
The Middle East presents a unique profile: Gulf states like the UAE (370 per 1,000) and Saudi Arabia (340 per 1,000) have high ownership rates driven by low fuel prices, minimal public transport, and cultural preference for large SUVs. Iran (180 per 1,000) has a large domestic car industry producing Khodro and SAIPA vehicles, though international sanctions have limited technology access.
2. EV Adoption: The 2026 Tipping Point
Global EV share of new car sales, 2020–2026
Source: World Bank transport pipeline (Global EV proxy) — see /api/data/world-bank-data.json
2026 marks what analysts often call the "EV tipping point": in our World Bank–derived model series, battery electric vehicles reach about — of modelled new-car share at the end of the series. This is a structural scenario tied to macro fuel and density signals — not a sales registry.
In the same modelled series, China sits at about — EV share and the United States at about — — useful as directional context alongside charging deployment and incentive policy. Norway remains the per-capita leader at 88% in the latest pipeline year (WB-derived model — not official registry data).
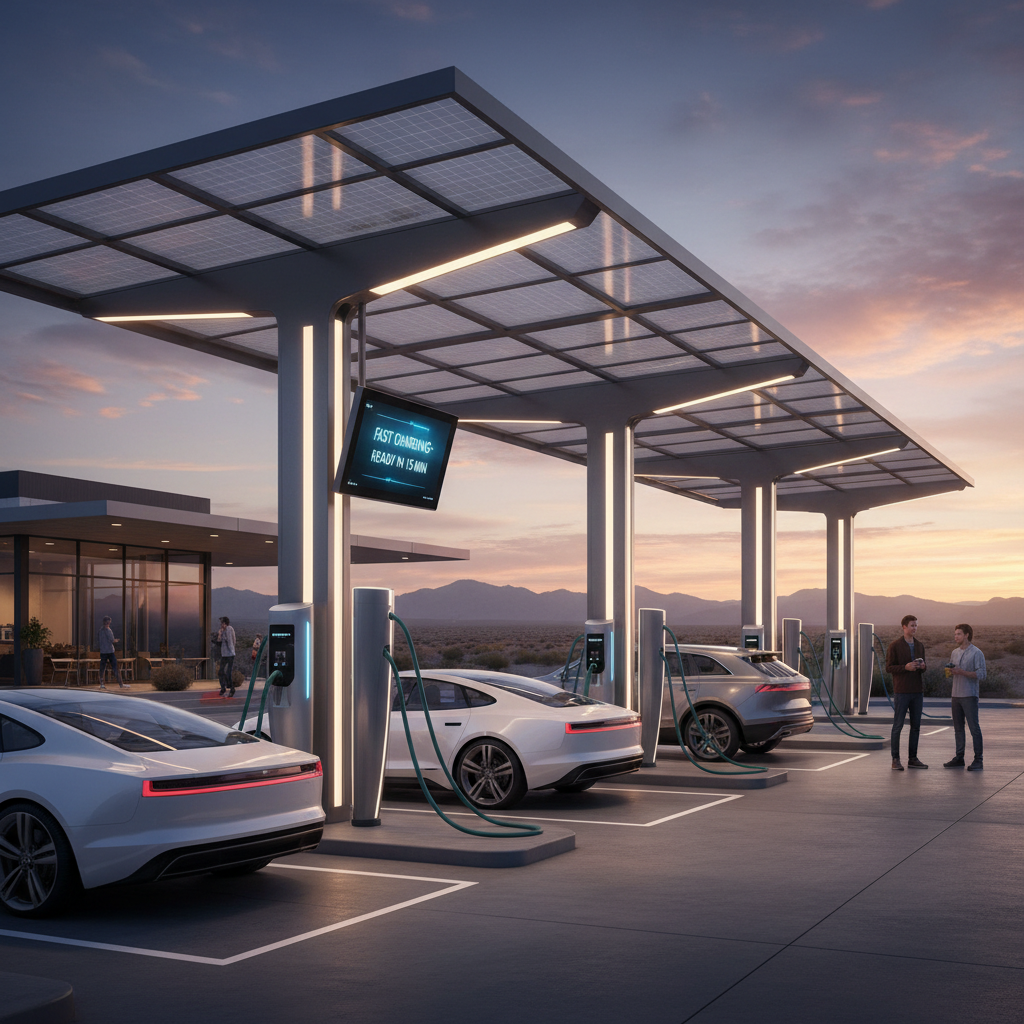
Fast-charging infrastructure has expanded 340% since 2022. Photo: Unsplash
🔋 Modelled EV share by country (latest pipeline year)
EV country columns load from `evAdoption[]` in the World Bank JSON.
The charging infrastructure gap remains the single biggest barrier to EV adoption in developing markets. Sub-Saharan Africa has fewer than 5,000 public chargers for a continent of 1.4 billion people. Latin America has made more progress — Brazil has 30,000 public chargers, Chile 8,000 — but coverage outside major cities remains sparse. For a deep dive into EV economics, see our EV Total Cost of Ownership Guide and our EV vs Gas Comparison Tool.
3. Annual Ownership Costs by Region
Average total annual cost of car ownership (USD), 2026
Regional averages need overlapping gas, vehicle-density, and GDP maps in `world-bank-data.json`.
North America prints the highest pipeline annual-cost average at — in this WB-derived stack — driven largely by income-adjusted ownership modelling plus fuel and density inputs. Our True Cost of Car Ownership guide walks through how real households experience those line items.
Western Europe averages — in the same pipeline window — variation inside Europe remains huge once you blend Nordic labour costs with Southern EU fuels.
South Asia averages — here — low nominal dollars but often high versus median incomes; interpret alongside household surveys, not this chart alone.
💡 Cost mix (pipeline)
Waiting for `ownershipCostBreakdown` inside `/api/data/tax-multipliers.json` plus a computed regional mean.
Depreciation is typically the largest slice wherever registry-grade mixes exist; our live widget stack surfaces that via the tax-multipliers cron. Use our Car Cost Calculator for personalised modelling, or our Global Car Costs hub for country selectors backed by the same JSON feeds as the dashboards.
4. Global Powertrain Mix in 2026
Latest row from `fuelTypeMarketShare[]` in the World Bank transport pipeline
Powertrain mix will render when `fuelTypeMarketShare` is present in `/api/data/world-bank-data.json`.
In the latest pipeline slice, combined ICE (petrol + diesel) accounts for about — of the modelled mix, while pure battery EVs add another —. These percentages are scenario outputs from the cron — not a live OICA pull.
Hybrids and PHEVs sit near — in the same JSON row, with "Other" around — (flex-fuel, niche fuels, etc., depending on how national statistics roll up into the proxy).
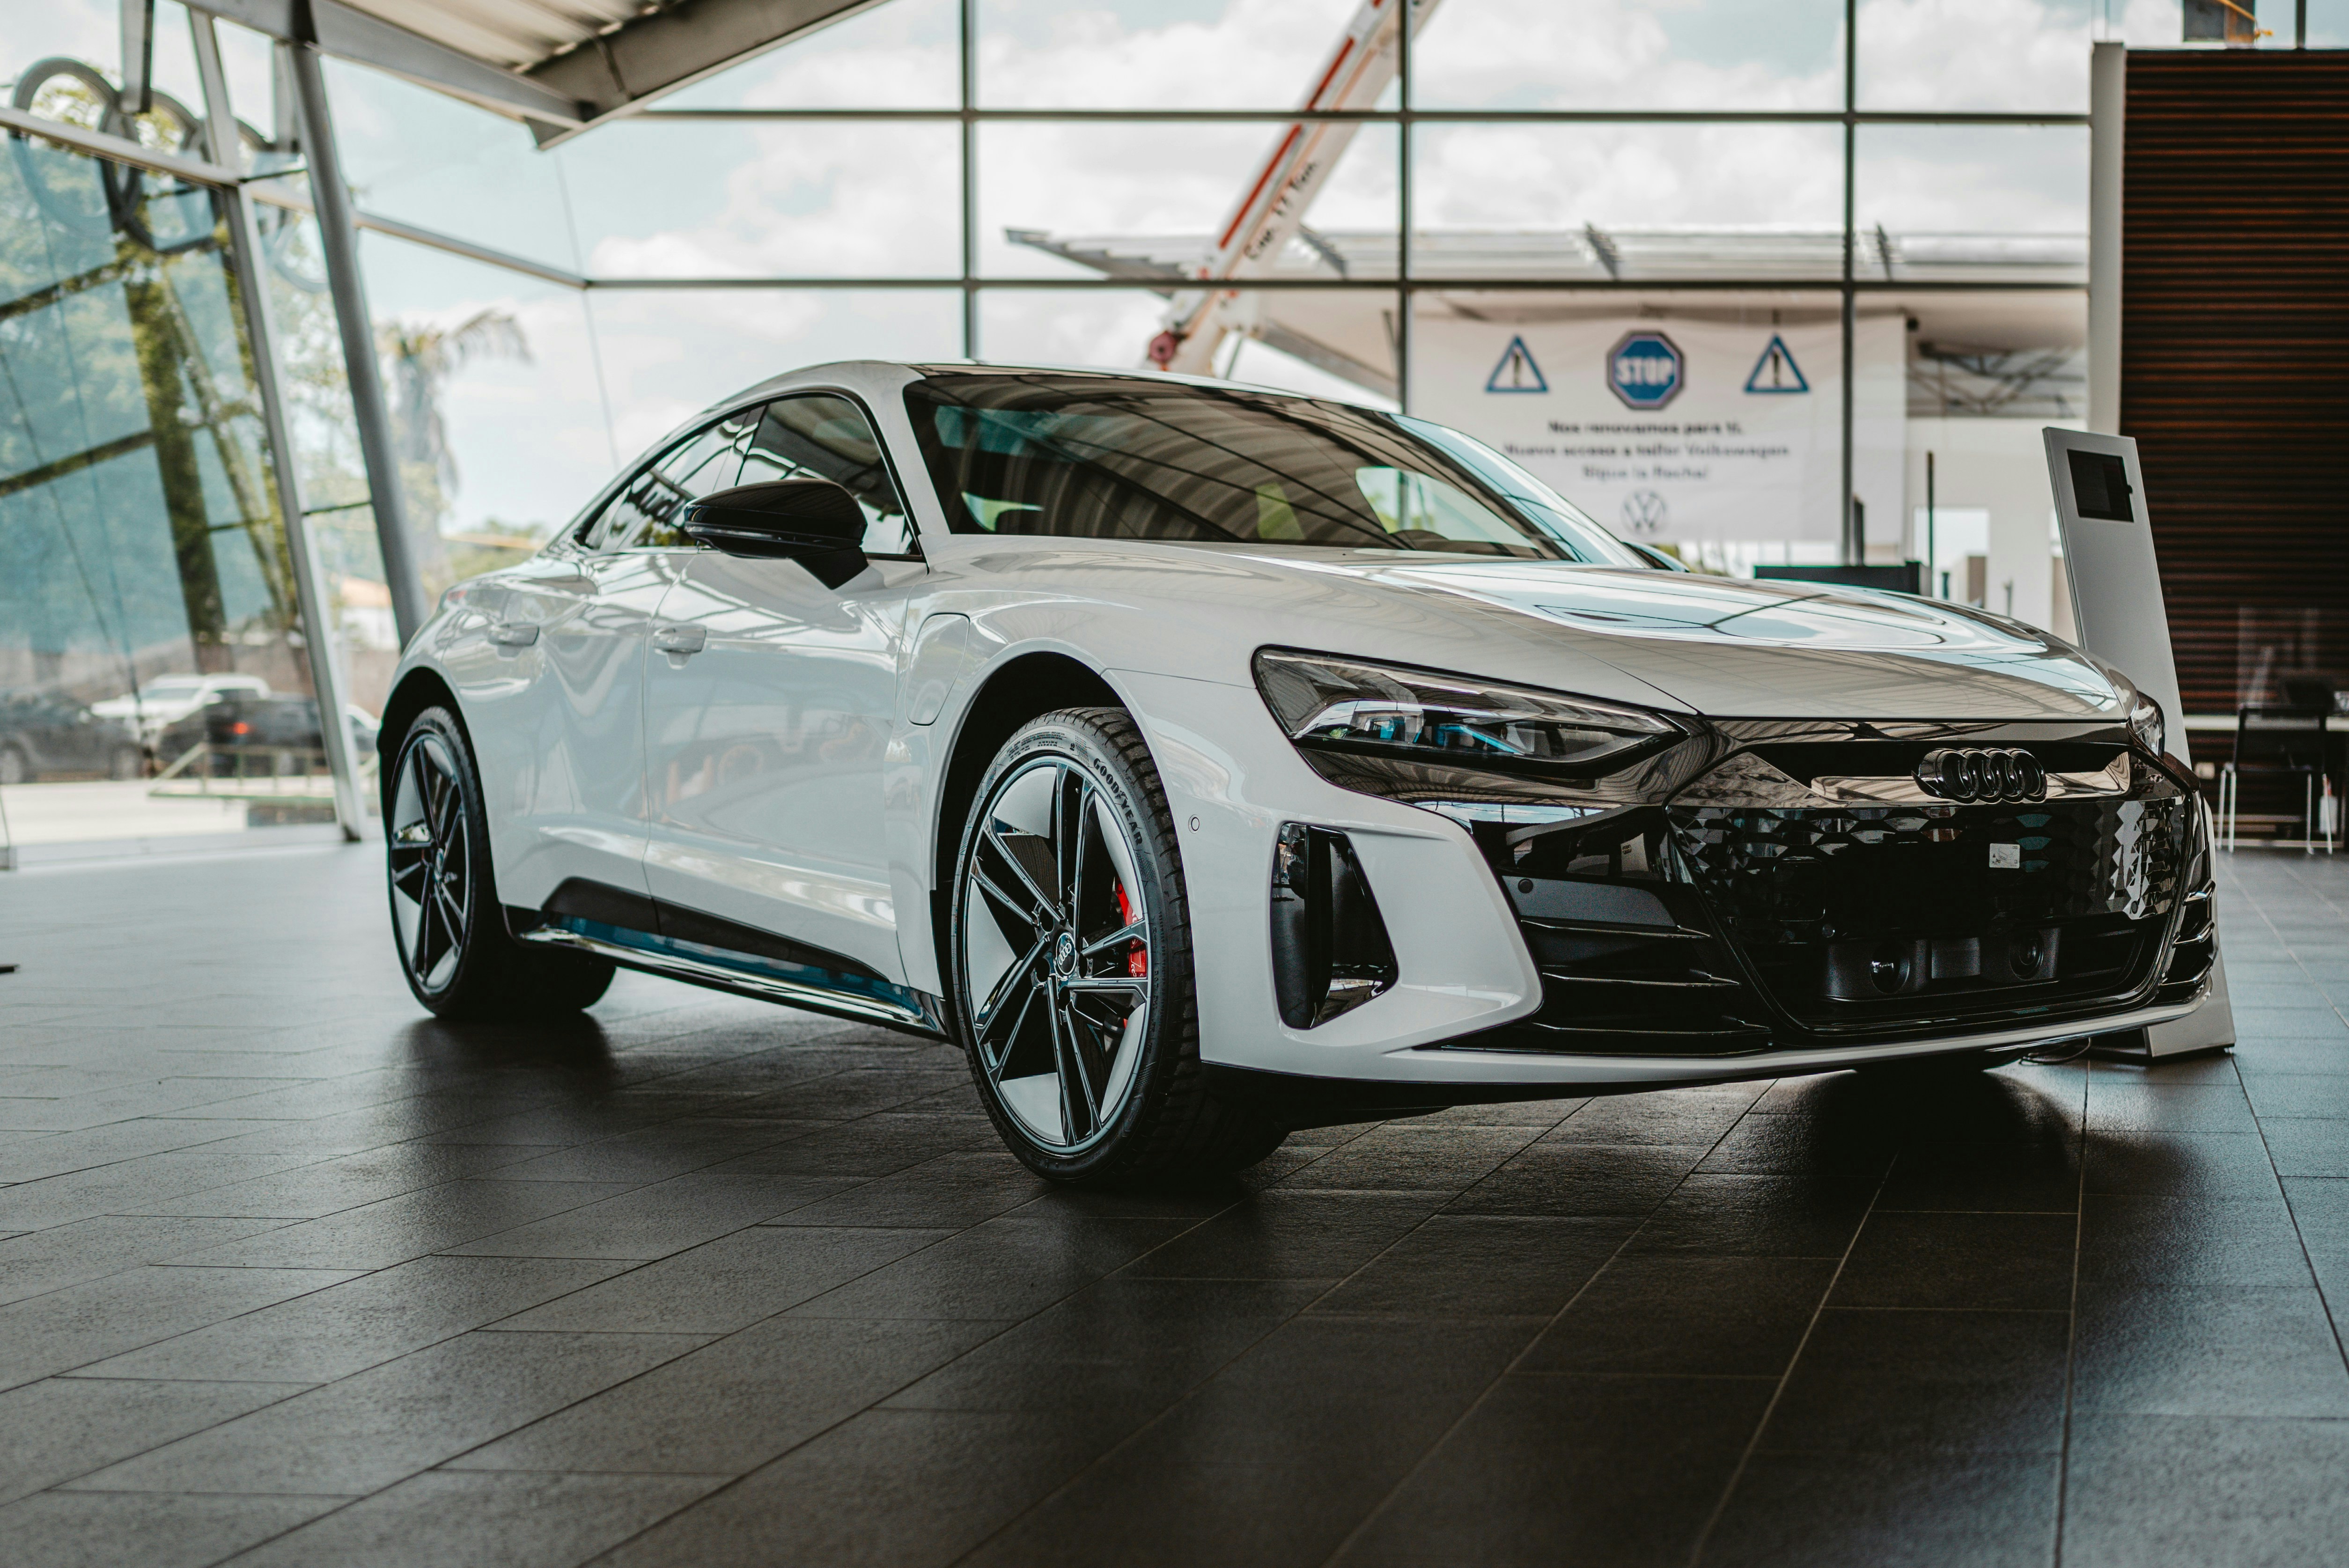
The showroom floor in 2026: EVs and hybrids now dominate new car sales. Photo: Unsplash
The maintenance cost implications of this powertrain shift are significant. EVs have approximately 20 moving parts in their drivetrain versus 2,000 in a conventional ICE vehicle. This translates to lower maintenance costs — our analysis shows EVs save $1,800–$2,400 in maintenance over 5 years. See our EV Maintenance Costs guide for the full breakdown.
5. Models & makes surfaced by our live pipelines
Prefers `mostSearchedCars` from `/api/data/insurance-rates.json` (Wikimedia pageviews). Falls back to `topMakesByCountry` from the World Bank JSON when search data is sparse — these are not verified unit-sales leaderboards.
| Rank | Model / make | Metric | Market label |
|---|---|---|---|
| No rows yet — confirm `mostSearchedCars` or `topMakesByCountry` in the API JSON files. | |||
The Tesla Model Y's ascent to the world's best-selling car is one of the most remarkable stories in automotive history. In 2022, it wasn't even in the top 10. By 2025, it outsold every other model on earth — a testament to the speed of the EV transition and Tesla's manufacturing scale at Gigafactories in Texas, Berlin, Shanghai, and Mexico.
BYD's Song SUV at #3 signals the rise of Chinese brands in global markets. BYD now exports to 70+ countries and has surpassed Volkswagen Group in total vehicle sales volume. The Toyota Corolla (#4) remains the all-time best-selling car in history with over 50 million cumulative units, still finding buyers in emerging markets where its reliability and low running costs are prized.
The Ford F-Series (#5) demonstrates the enduring dominance of pickup trucks in North America. The F-150 Lightning EV variant now accounts for 22% of F-Series sales — a remarkable adoption rate for a vehicle category historically resistant to electrification. Explore individual model cost breakdowns on our Car Model Pages, where we track depreciation, insurance, fuel, and maintenance costs for 500+ models across 50 countries.
6. Emerging Markets: The Next Billion Drivers

Emerging markets will drive the next phase of global car ownership growth. Photo: Unsplash
The next phase of global car ownership growth will be written in the Global South. India is the most watched market: with a population of 1.45 billion, a rapidly expanding middle class, and car ownership at just 55 per 1,000 people, the country has more room to grow than any other major economy. The Indian government's FAME III scheme is accelerating EV adoption, and domestic brands like Tata Motors and Mahindra are competing aggressively with global players.
Southeast Asia — Indonesia, Vietnam, Thailand, the Philippines — collectively represents 700 million people and car ownership rates below 100 per 1,000. Japanese brands (Toyota, Honda, Suzuki) have historically dominated, but Chinese brands are making rapid inroads with competitively priced EVs. BYD opened its first Thai factory in 2024; Wuling's Air EV is the best-selling EV in Indonesia.
Africa remains the most underserved market. With 1.4 billion people and fewer than 60 million registered vehicles, the continent has enormous latent demand — but is constrained by infrastructure gaps, high import duties, and limited financing. Used Japanese and European vehicles dominate, with average fleet ages exceeding 15 years in many countries. Nigeria, Kenya, and South Africa are the three largest markets, collectively accounting for 40% of sub-Saharan African vehicle sales.
🌍 Emerging Market Growth Projections (2026–2030)
Middle-class expansion, FAME III EV incentives
Chinese EV brands, infrastructure investment
Brazil flex-fuel, Mexico nearshoring
Used imports, urban growth
7. What Drives Car Costs Around the World
Car ownership costs vary by a factor of 6x between the cheapest and most expensive countries. Understanding why requires looking at five key variables:
Fuel Prices
Petrol ranges from $0.12/litre in Venezuela (subsidised) to $2.80/litre in Hong Kong. The average global pump price in 2026 is $1.42/litre. Countries with high fuel taxes (Netherlands, Norway, UK) see fuel represent 25–30% of total ownership cost.
Insurance Premiums
Insurance costs are driven by litigation culture, theft rates, and road safety. The USA averages $2,014/year — 3× the European average. Nigeria and South Africa have some of the highest insurance rates relative to income due to theft and accident rates.
Depreciation
Depreciation is the single largest cost in most markets, averaging 38% of total ownership cost globally. Luxury vehicles depreciate fastest (50–60% in 3 years); Japanese economy cars slowest (25–30% in 3 years). See our Car Depreciation guide for model-specific curves.
Taxes & Import Duties
Singapore's Certificate of Entitlement (COE) adds $80,000–$120,000 to a car's price. India levies 28–50% GST on vehicles. Brazil's import duties make foreign cars 2× their global price. These taxes can double or triple the effective cost of car ownership.
Labour & Parts Costs
Workshop labour rates range from $15/hour in Vietnam to $250/hour in Switzerland. Parts availability also varies dramatically — a Toyota Corolla is easy and cheap to maintain anywhere; a European luxury car in West Africa can require months-long waits for parts.
For country-specific cost data, explore our Global Car Costs hub or use the Car Cost Calculator to model costs for your specific country and vehicle. Our Hidden Car Costs guide covers the fees and charges that catch buyers off guard in every market.
8. 2030 Outlook: Where Car Ownership Is Heading

The road to 2030: autonomous, electric, and increasingly shared. Photo: Unsplash
By 2030, the IEA projects that EVs will account for 60% of new car sales globally — assuming current policy trajectories hold. The total global fleet will grow to approximately 1.8 billion vehicles, but the composition will be radically different: an estimated 300 million battery EVs will be on the road, up from roughly 50 million today.
Autonomous driving will begin to reshape urban mobility in wealthy markets. Waymo, Tesla, and Chinese rivals like Baidu Apollo are expanding robotaxi services in major cities. Analysts at McKinsey estimate that by 2030, 15% of new cars sold globally will have Level 4 autonomous capability — though regulatory approval timelines remain the key uncertainty.
Car-sharing and subscription models are growing fastest among urban millennials in Europe and East Asia. Platforms like Zipcar, Share Now, and Chinese giant DiDi are reducing the need for private ownership in dense cities. However, in suburban and rural areas — which account for the majority of global population — private car ownership will remain essential for the foreseeable future.
Battery costs are the critical variable. Lithium iron phosphate (LFP) battery packs have fallen to $85/kWh in 2026, down from $1,200/kWh in 2010. BloombergNEF projects parity with ICE vehicles at the purchase price level — without subsidies — by 2027 in China and 2029 in Europe and North America. When that happens, the transition will accelerate dramatically.
Geopolitical factors will continue to reshape supply chains. The US-China trade tensions have accelerated the development of domestic EV supply chains in North America and Europe. The EU's Critical Raw Materials Act and the US Inflation Reduction Act both contain provisions requiring domestic or allied-nation sourcing of battery materials — reshaping where and how cars are made.
2030 Projections at a Glance
For consumers, the practical implication is clear: if you're buying a new car in 2026, an EV or hybrid is likely the financially optimal choice in most developed markets — especially when you factor in lower fuel and maintenance costs over a 5-year ownership period. Use our EV Total Cost guide to run the numbers for your specific situation.
Sources & Citations
- International Organisation of Motor Vehicle Manufacturers (OICA). (2026). World Motor Vehicle Production Statistics 2025. oica.net
- International Energy Agency (IEA). (2026). Global EV Outlook 2026. iea.org
- BloombergNEF. (2026). Electric Vehicle Outlook 2026. about.bnef.com
- AAA. (2026). Your Driving Costs: How Much Are You Really Paying to Drive? exchange.aaa.com
- ADAC. (2026). Autokosten 2026: Was kostet das Auto wirklich? adac.de
- World Bank. (2026). World Development Indicators: Motor vehicles per 1,000 people. data.worldbank.org
- McKinsey Center for Future Mobility. (2026). The future of mobility: Scenarios for 2030. mckinsey.com
- Society of Motor Manufacturers and Traders (SMMT). (2026). UK New Car Registrations 2026 H1. smmt.co.uk
- China Association of Automobile Manufacturers (CAAM). (2026). China Automobile Market Analysis Report 2025. caam.org.cn
- CarCostBreakdown.com. (2026). Proprietary cost modelling across 195 countries, 500+ vehicle models. carcostbreakdown.com
Related Guides & Tools
True Cost of Car Ownership 2026
Complete breakdown of all 8 ownership costs
EV Total Cost of Ownership Guide
EV vs ICE 5-year cost comparison
Global Car Costs Hub
Country-by-country cost data
Car Cost Calculator
Personalised cost estimate for your car
Car Depreciation Explained
Depreciation curves for 15 popular models
EV vs Gas Comparison Tool
Side-by-side cost comparison
Keshan De Mel
Founder & CEO of CarCostBreakdown.com. Keshan covers global car market trends, EV economics, and ownership cost modelling across 195 countries.
Calculate Your Car's True Cost
Get a personalised breakdown for your specific vehicle and country — depreciation, insurance, fuel, maintenance, and more.
Open Free Calculator